Debugging Tools
Test Value
When developing shaders, new rendering techniques, VFX or materials, it's often useful to perform A/B testing of different code paths in a shader or rendering pipeline. To do it, engine contains Graphics.TestValue command value as debug utility to control visual or rendering features during development. For example, can be used to branch different code paths in shaders for A/B testing (perf or quality). The value of it can be changed via console or from code (even in non-Release builds).
Profiler
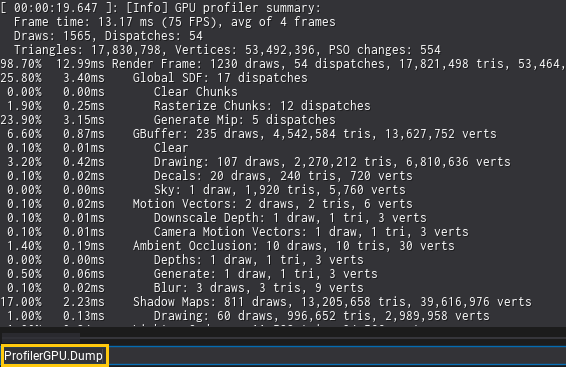
Graphics profiling can be done via external tools or right inside the engine via Profiler or ProfilerGPU.Dump command. It profiles next frame(s) rendering performance and dumps the results to the log (as a hierarchy structure). When using more than 1 frame, the results are averaged for more accurate profiling (especially for A/B testing).